Here is an all-too-common scenario for businesses and organisations which have their precious data stored in Salesforce:
- Step 1: Data analyst runs 25 Salesforce reports – based upon various objects, business rules and analytics requirements – and exports as csv’s.
- Step 2: He/she imports the csv’s into Google Sheets, Microsoft Excel, or a similar spreadsheet tool.
- Step 3: Lucky analyst spends hours and days massaging said csv’s into the desired report – connecting, aggregating, transforming, calculating, and fudging.
- Step 4: Finally, after many tedious, error-prone hours, the report is ready for delivery to businesses leaders.
- Step 5: Business leaders review this report in a PDF – and complain that it is inflexible, questionable, and out-of-date.
- Step 6: Data analyst cries.
Does this sound familiar?
If so, why does this happen? After all, you’re using the world’s #1 CRM. You’re paying an expensive team member to analyse data – but they’re spending much of their time aggregating, not analysing. One of the main reasons that you purchased Salesforce is for those all-important business reports, yet somehow that ROI is largely escaping you.
Why?
There are a number of possible reasons, including:
- Your Salesforce org has customisations and complexities that make comprehensive reporting in Salesforce difficult, if not impossible.
- You want to report on data which is based upon complex object relationships that cannot be handled by custom report types.
- Your business rules and reporting requirements are too complex to be managed in Salesforce reports.
- You want to show a variety of reports from different objects on a Salesforce dashboard, but the filters don’t want to co-operate…
- You want to combine external data with Salesforce data.
So, what can you do? You have two options:
- Remain trapped in this vicious cycle
- Break free by employing Einstein Analytics
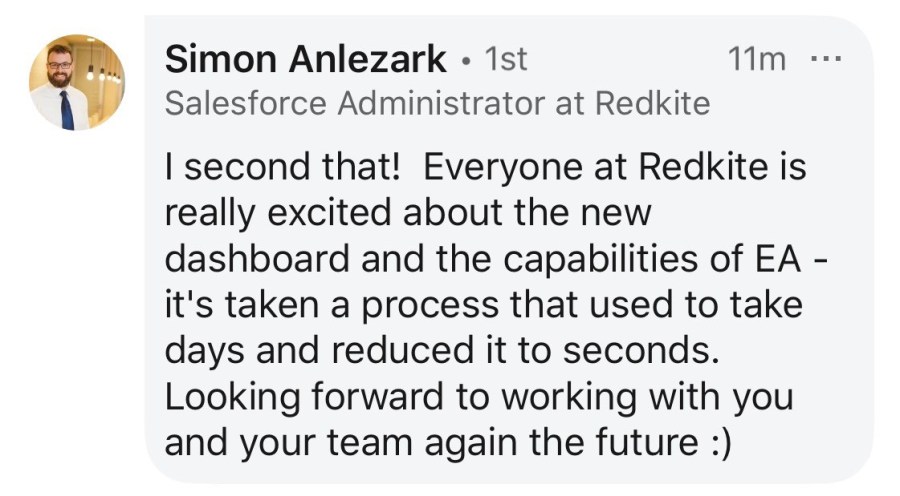
Case in point: Redkite.
The team at Redkite have valuable service delivery data stored in Salesforce, but getting that data into a regular service delivery report was, well, challenging. It involved exporting Salesforce reports into Excel and a whole lot of man hours. Painful.
“Because of the limitations of our existing system, these reports have been incredibly manual and time consuming, taking days to produce, and involving the manual export and combining of many reports in excel.
This meant that valuable time which could have been spent exploring trends and gaining insights for service development were instead spent reporting on critical but basic metrics.” (Kailly Hill, Lead, Strategic Outcomes and Measurement)
But, they implemented Einstein Analytics with some expert help, and built a dataset that does all the hard work for them. What was the end result? According to Kailly:
“Visioneer360 created a dataset in Einstein Analytics that overcame all of the restrictions we faced in Salesforce, enabling us to combine data from multiple objects to provide a ‘whole of services’ view of our data.
They also created a live, dynamic and visually appealing dashboard that provided us with our key metrics instantly, while also allowing us to drill down easily into those metrics.”
To sum it up:
So, what will you do?
- Remain trapped in this vicious cycle
- Break free by employing Einstein Analytics
Addendum:
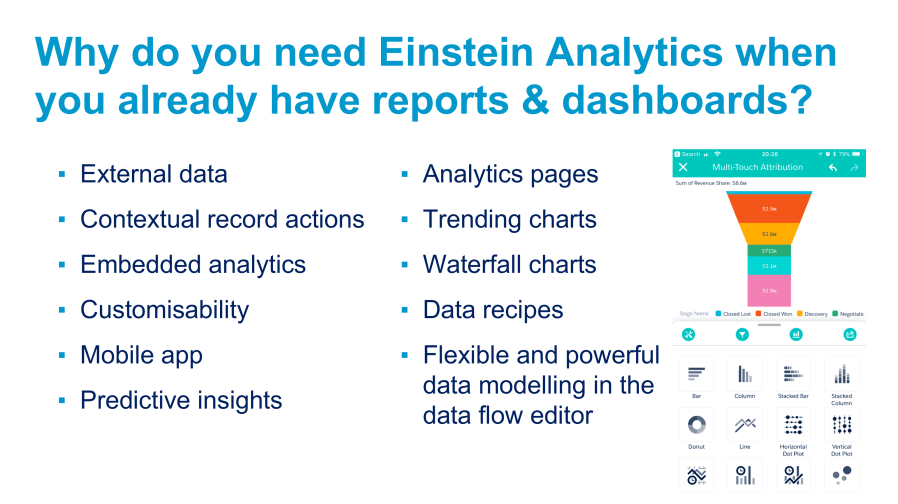
Why do you need Einstein Analytics when you already have Salesforce reports and dashboards? See here

1 Comment