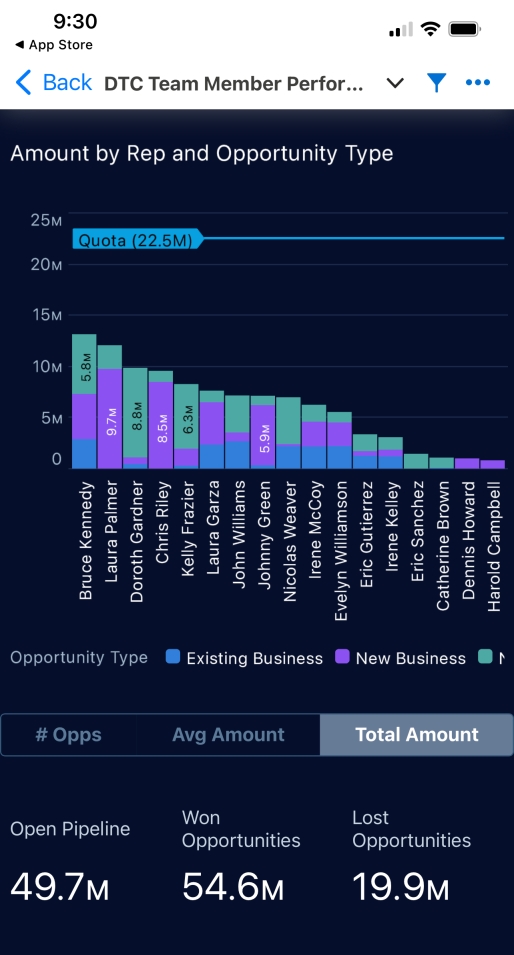
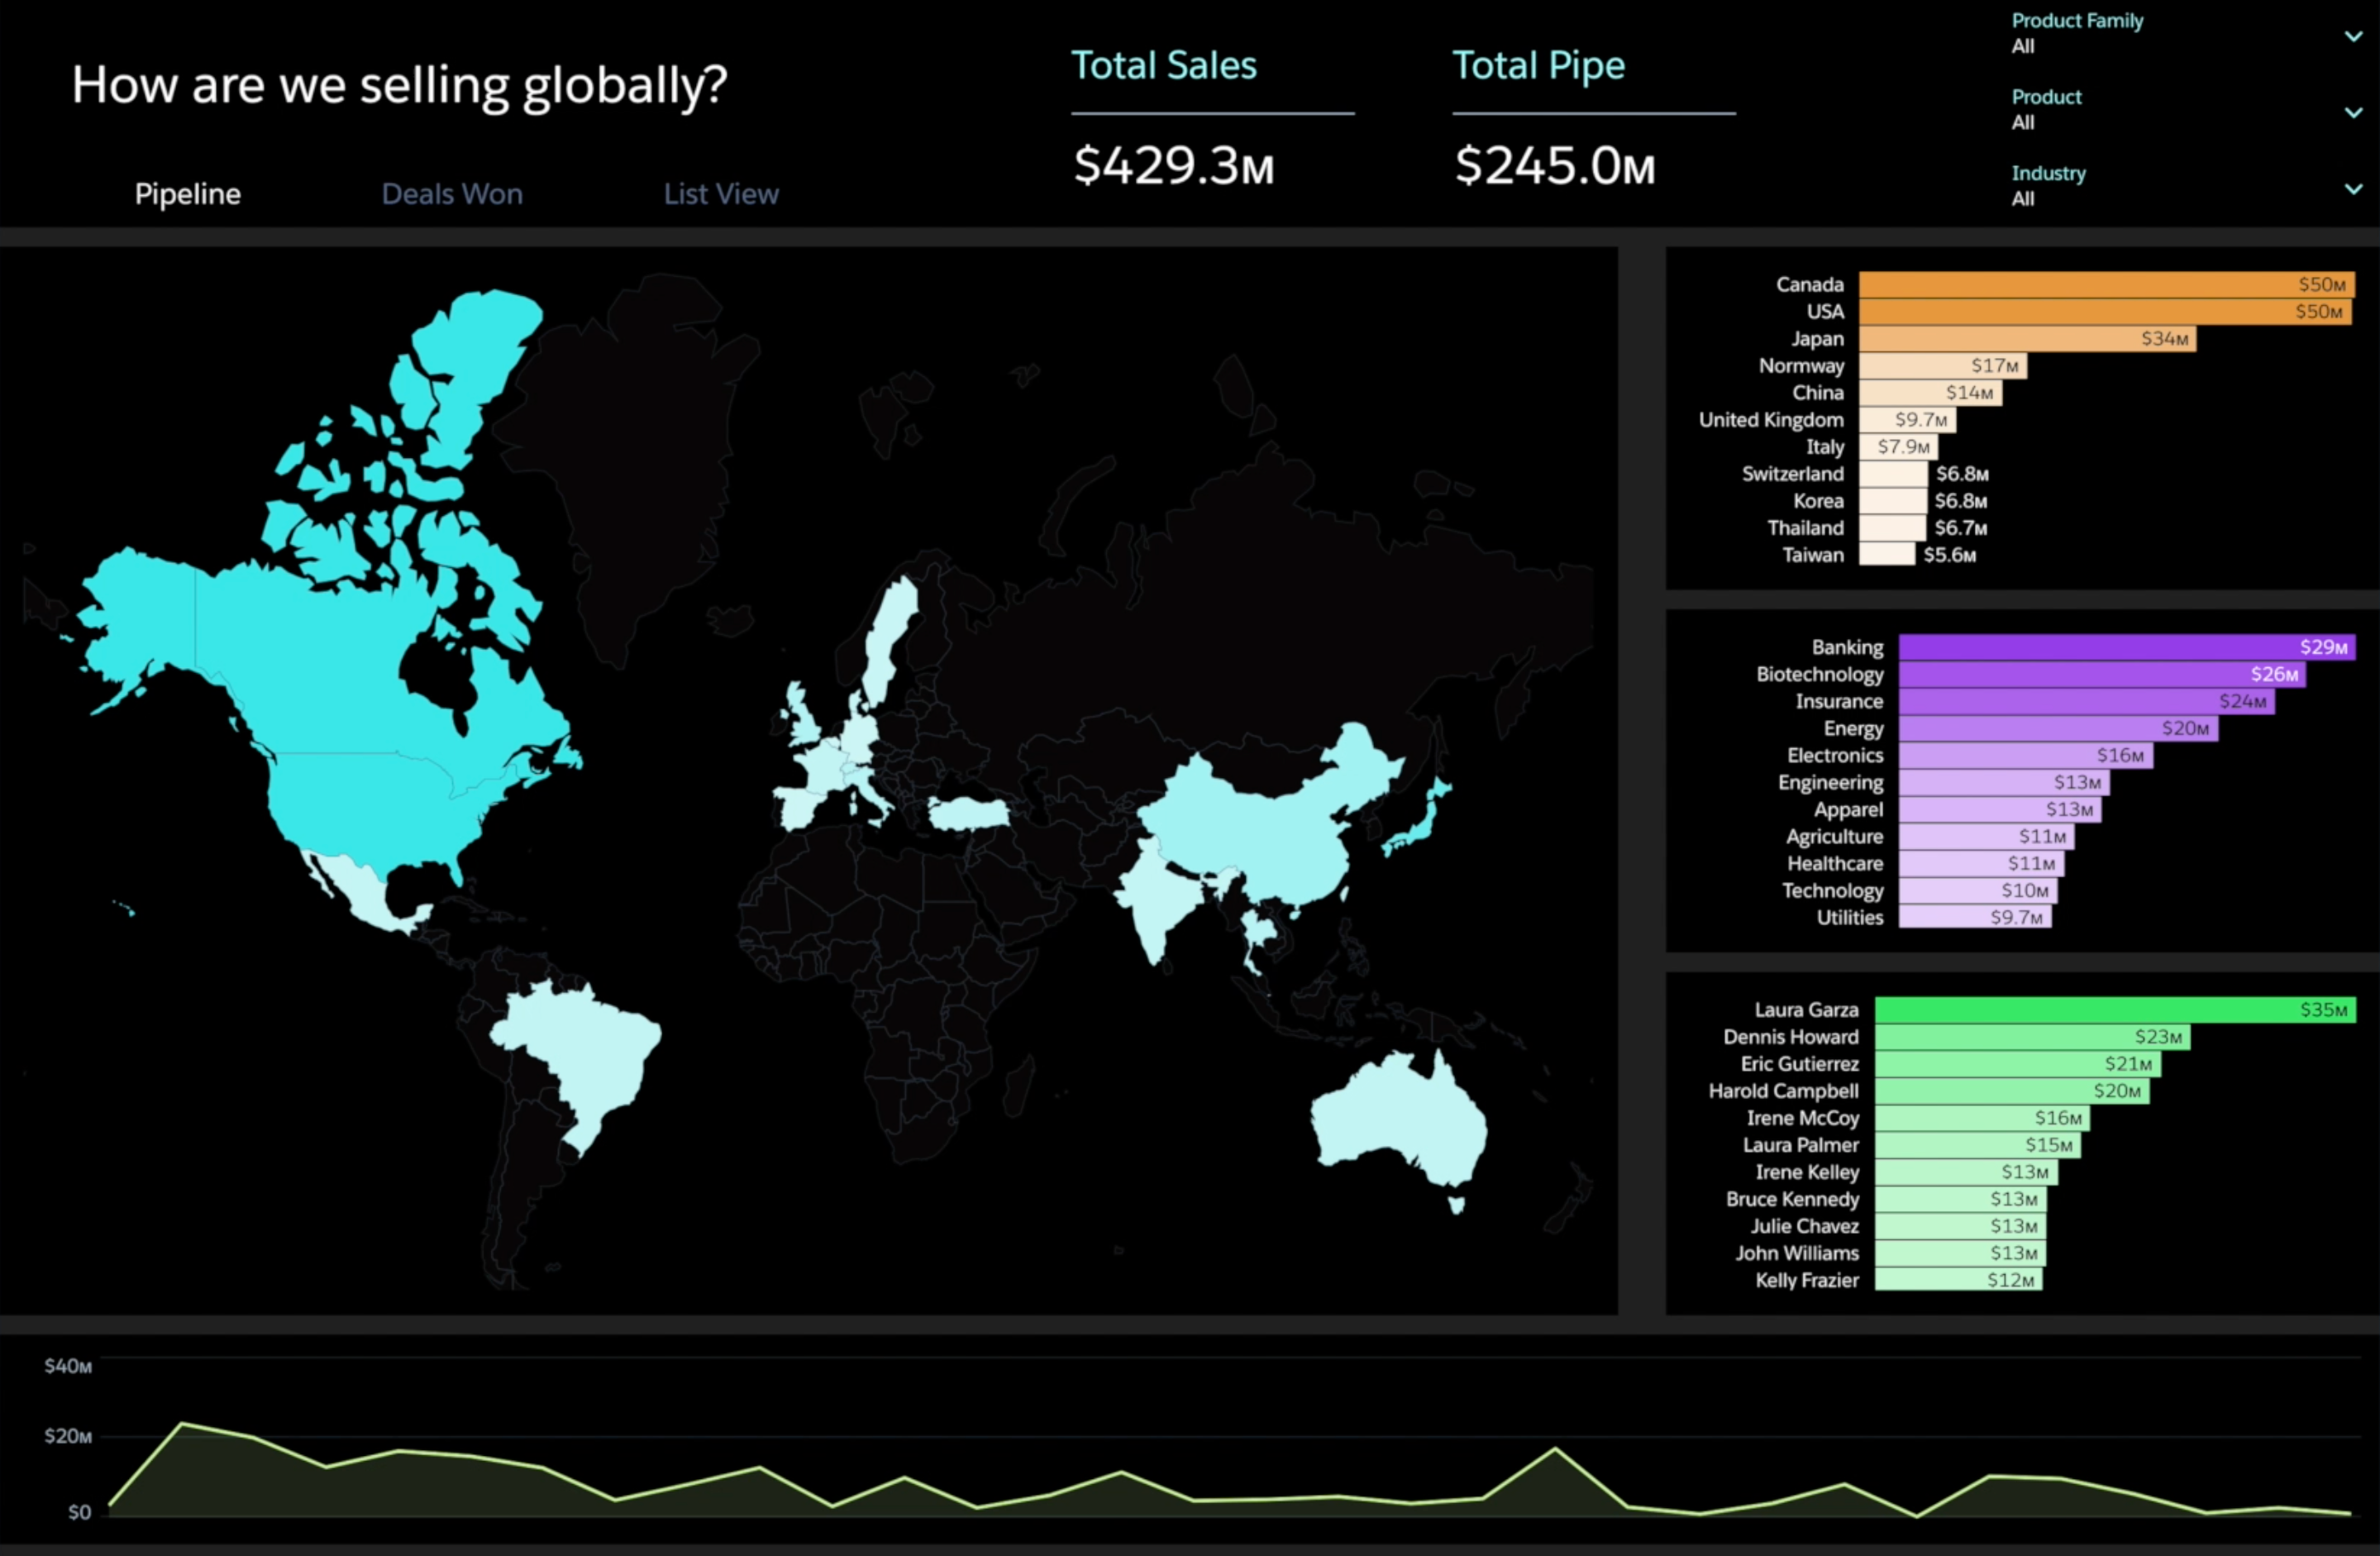
You’re using Salesforce, the #1 CRM in the world. It comes with best-in-class native analytics, providing powerful, customisable reports and dashboards. It’s working really well for your team or business.
Why, then, do you need Tableau CRM (formerly Einstein Analytics) when you already have Salesforce reports and dashboards?
If you would to go to the effort and expense of adopting Tableau CRM (TCRM), you need a “Why?” You must understand the differences between TCRM and your native analytics, and you need to identify your business use case/s, in order to justify the change. I know – I helped guide a wealth management business through this process after we had implemented Financial Services Cloud and built some very effective reports and dashboards. It wasn’t easy – but the end result was revolutionary.
Why do you need TCRM?
First, you will never replace native Salesforce reports and dashboards with TCRM.
The analytics capability built into Salesforce is powerful and flexible, easy to configure, and simple to learn. It can meet many organisational needs out of the box, and analysts can achieve a great business result with this tool. Salesforce reports and dashboards are always relevant and useful, and they are often the “go to” option for a quick win. This is especially true as Salesforce continues to develop and refine their native analytics. To quote Rikke Hovgaard, “Use operational reporting for generating lists of data, preferably data or questions that don’t change too often. Dashboards are based on your reports and show a snapshot of data at the runtime. Everybody has access to reports and it’s easy to export your reports.”
However, Salesforce analytics is a tool – TCRM is a platform. There is a fundamental difference between the two, as you will see.
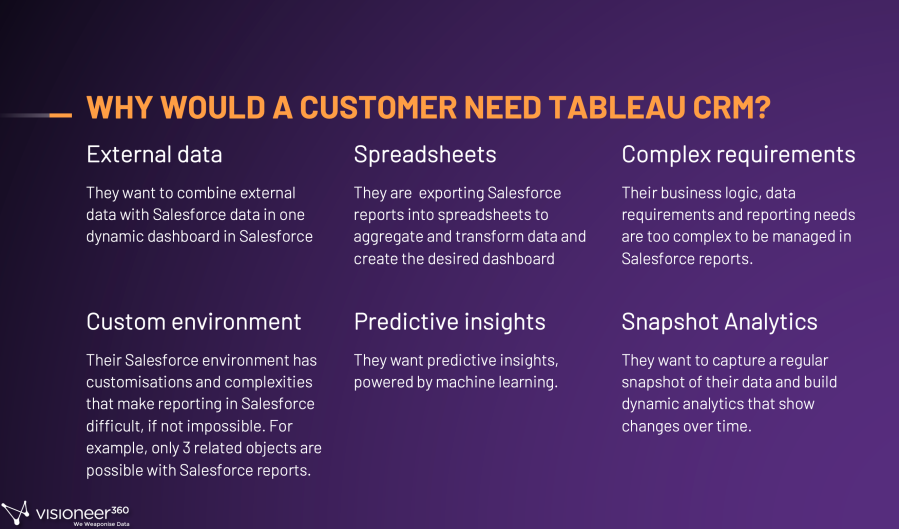
Second, there are some excellent business reasons for implementing TCRM, including:
- Augmented analytics is the future of business insights. Using the power of machine learning and artificial intelligence, TCRM brings your data to life in a way that cannot be done manually. It delivers powerful predictive and prescriptive analytics and insights.
- TCRM provides a genuine 360-degree view of your customer.
- TCRM enables you to take immediate, contextual action on insights to create tasks, open your customer record, chatter to team members, and take action in Salesforce. Data -> Insight -> Action.
- Bulk actions in TCRM enable you to drill into your data then action hundreds of thousands of records in bulk with just a few clicks. Awesome!
- TCRM dashboards are embedded on your Customer record, right there in your business process, with any data from Salesforce and other systems. This greatly increases user adoption.
- Collaboration – TCRM turns analytics from a pie chart into a conversation! (Thanks, Peter Lyons, for this slogan!). Charts can be annotated, shared and discussed in moments through a variety of means.
- TCRM accelerates your adoption of Salesforce and amplifies your ROI to become a true customer-focused, data-driven organisation.
- TCRM gives Salesforce users the ability to analyse not just Salesforce data but external data as well, taking analytics from looking at disconnected graphs to a far more meaningful analysis through interactive dashboards.
- With TCRM, external data can be processed, manipulated, connected and visualised without storing it in your Salesforce org, saving valuable space, and helping to preserve your sanity.
- TCRM provides another level of customisability, empowering impressive and engaging visualisations, and enabling company or team branding.
- Then there is the beautiful and functional mobile app for TCRM!

- TCRM is a complete enterprise data solution that is far more capable native Salesforce analytics. It is a true business insights platform.
- TCRM pages help create experiences that enable people to become productive by starting with data, and visualising what has changed, without moving the user away from an operational experience. Pages make the analytics experience layered without looking at three-page reports.
- TCRM has dynamic, customisable trending and waterfall charts! Look back over trends to get insights into how things are changing and why, and drill down as deep as you want, thus overcoming the limitations of the snapshot nature of native reports.
- Snapshot analytics in TCRM enables you to take a daily snapshot of your datasets and analyse how they are changing over time. You can also snapshot your data hourly, weekly, etc, and have total control over trending and comparison insights. Game changer!
- TCRM offers powerful functions in compare tables that can help you rank, label and manipulate data without code.
- The ETL tools available in TCRM – Data recipes and data prep – let you use an intuitive UI to profile and clean data for better use in analytics, harmonising data across sources, etc.
- You can combine and analyse objects and fields any way you want in TCRM. Say goodbye to just four layers of connectivity!
I recommend that you reference Rikke’s blog for a detailed comparison of technical features and capability.
Also, here is comparison of Salesforce reports, Tableau CRM, and Tableau.
In conclusion, compared to Salesforce reports, TCRM offers greater insight and contextual next steps all in one place. Fast.
Would you like my help with Salesforce reports or Einstein Analytics? Click here.
Thanks to many friends and colleagues for their input on this subject, including Rikke Hovgaard, Peter Lyons, Jennifer Shier, Brendan Verma, Carl Brundage, Ziad Fayad, Umair Rauf, and others. You guys rock!
References:
- Einstein Analytics vs. Operational Reporting – what is the difference?
- Einstein Analytics Demo video
- Moving beyond data visualisation to predictive analytics
- Let’s Play Salesforce
- What is augmented analytics and why does it matter?


3 Comments