
Creating meaningful analytics from multiple datasources, where the dashboards are interactive, connected, and actionable, was a daunting task for an analytics developer not too long ago. A Salesforce admin without programming training and experience would not have attempted to build such advanced business analytics – not if he or she was in his or her right mind.
Things have changed, and for the better. The investment of Salesforce in a BI system that plugs into their CRM and can be built, largely, through a declarative interface, has changed the BI landscape. Although not without a need for further development, Einstein Analytics is, in my opinion, pretty darn cool.
In the process of building some fairly complex Salesforce dashboards, I found myself hitting an invisible wall, so our Solutions Engineer suggested that I look into Einstein Analytics – formerly Wave Analytics – as our Financial Services Cloud package made Einstein Analytics (EA) available to us without any additional license fee. I had heard of EA, but had never studied or used it. EA looked both cool and promising, so I did some more digging. A U.S.-based consultant quoted US$60,000 for 500 hours of work to configure EA and build four key dashboards for us, but I felt that I could learn the system and build the analytics we needed. So, I dived in and began to learn EA, largely through blogs, webinars, and Trailhead (see this blog). This all started about six weeks ago.
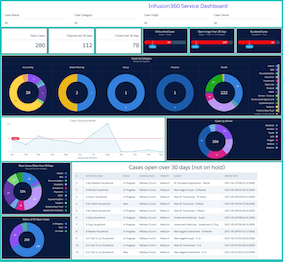
What I found was a complex and powerful system. We now have four beautiful and functional business dashboards that display critical key data from all segments of our wealth management business (InFusion360), enabling us to make informed decisions around marketing, sales, service, and operations. By the way, the standard Sales Analytics and Service Analytics apps that are available to most EA users are not available to us, due to a licensing issue, so I created all four dashboards from scratch, including the creation of datasets and the linking required to facet datasets as one.
Example dash (details obscured):
The purpose of analytics is to make sense of data so that leadership can make smart business decisions. We have achieved this with our implementation and development of Einstein Analytics, and we see great potential in further development for us, and for other business applications. It is very, very powerful in a business context.
All, I might add, without code, without a consultant, and with very little experience.
So, here are my beginner’s thoughts about Einstein Analytics:
Ten things that I love about Einstein Analytics
- I love the fact that the dashboards are fully interactive, allowing you to filter, drill-down, and perform record actions, all from the dashboard level.
- I love the fact that you can customise the analytics ad infinitum. A great deal of customisation can be achieved without code, and even more with code.
- I love compare tables, with the ability to incorporate formulas and filter data columns independently of one another.
- I love the aesthetics. We live in a visual age, so crappy aesthetics can easily obscure great analytics.
- I love being able to draw in data from multiple sources, link them together, manipulate the data, and make sense of it in a gorgeous analytics dashboard. We are building out an integration using Informatica, and it’s going to be sweet.
- I love data transformations, such as augmentation and compute expressions. You can achieve some great results using these tools, and the UI does a terrific job of building and editing dataflows without the need for code. I am just delving into this, and it looks awesome.
- I love the notifications feature that allows us to set alerts around key business metrics.
- I love the full-screen presentation feature. This is one of my faves.
- I love the “download as image” feature for sharing.
- I love the visual interface for building and editing data recipes and data flows.
Five things that I dislike about Einstein Analytics
- I dislike having to clone a step, edit the clone, delete the original, and add the new step, just to modify the contents of a widget. I think this is fixed in the next release.
- I dislike the fact that the Sales Analytics and Service Analytics apps are not available to Financial Services Cloud users.
- I dislike the clunkiness of the security feature, “Security Predicate”. There has to be a better way to manage data visibility than this.
- I dislike the fact that there is no Trailhead module for learning JSON and SAQL.
- I dislike the fact that you lose your tabs when you refresh the browser page.
As you can tell, this business analyst has found himself, and his employer, a pretty amazing analytics tool. Was it scary and intimidating at first, considering my lack of training and experience (see here)? Yes. Was it possible to self-learn this complex system and build some cool stuff that has already helped our business? Yes. Have we even begun to see the potential of this system realised in our business? No.
Remember: The purpose of analytics is to make sense of data so that leadership can make smart business decisions. For that reason, Einstein Analytics ROCKS.
Recommended Resource: Cool Resources for Learning Einstein Analytics

2 Comments