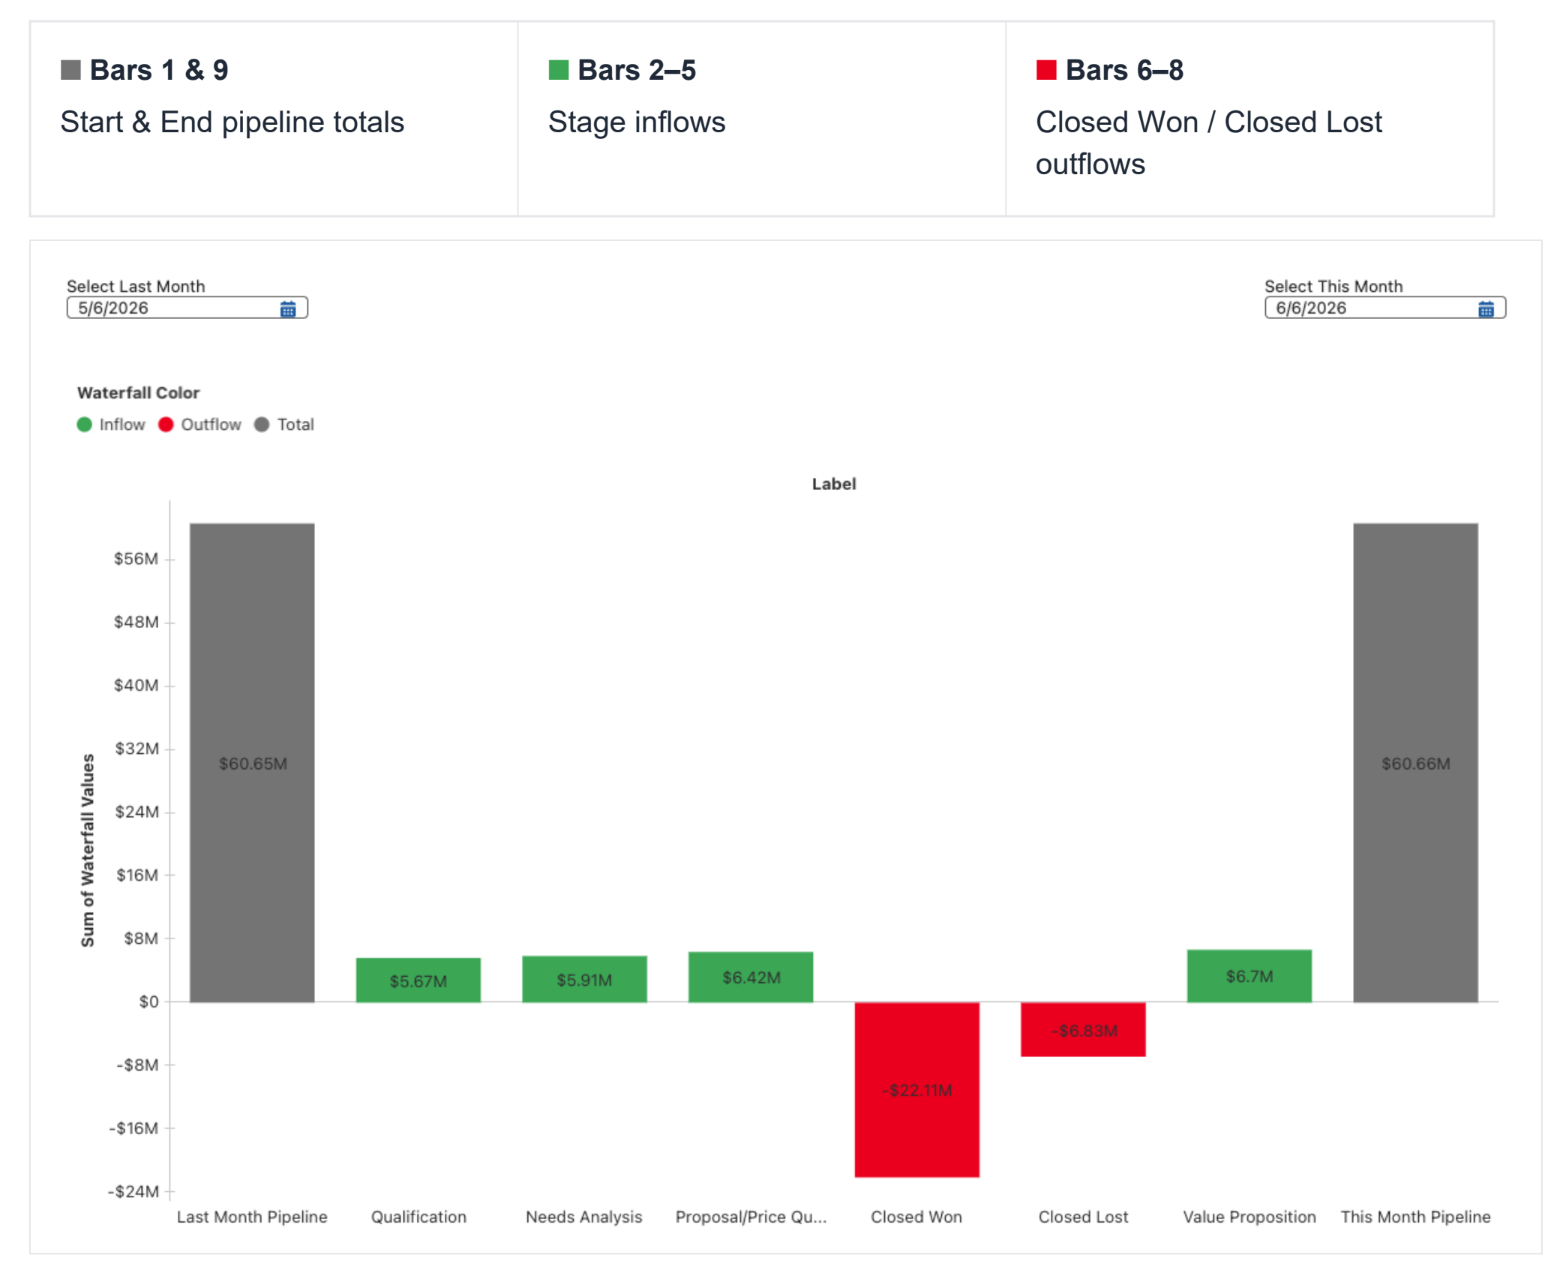
Sales leaders ask a deceptively hard question: why is our pipeline different today than it was last month? Standard Salesforce reports cannot answer it — they show current state, not movement. What came in, what closed, what churned out: the moment the period rolls over, that history is gone.
This guide fixes that.
It walks through the complete build of a pipeline waterfall in Tableau Next, powered by daily point-in-time snapshots in Data 360 (Data Cloud): the snapshot store, the batch transform, the semantic model, and the visualisation itself, with every formula included and a troubleshooting reference for the failures you won’t find in the documentation. Every step is verified end to end. Twenty-four pages.
View and download below.

